
retail in the city
Shopping

hospitality in the city
Bars & Clubs, Cafes, Restaurants, Takeaways, Bakeries, Accommodation.

business in the city
Professional & Business Services

culture in the city
Museum, Galleries & Places of Worship

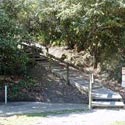
The total length of steps and ramps on Bluff Hill is 2,9km

The Bluff Hill Lookout is 105 metres above sea level
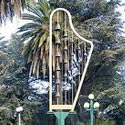
The harp-shaped carillon in Clive Square plays four tunes one minute apart, every half hour from 11.30am until 2pm daily.
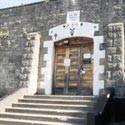
Napier Prison was NZ’s oldest prison and is the only building where it’s possible to see the original path of the 1931 earthquake.
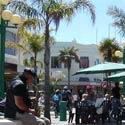
There are 94 palm trees along Emerson Street